Fetch Data into a Jupyter Notebook
Time required: 5 minutes
Prerequisites
You must have already:
- Signed up for a Matatika account
- Created a workspace through the Matatika app or API
- Published a dataset or access to an existing dataset
Introduction
Each dataset has a data endpoint, which returns live data from the database workspace schema based on the dataset query. The Matatika library fetch method is used to tap into this endpoint and return a snapshot of the dataset data. Using a Jupyter Notebook, we can create an interactive environment to fetch some data and perform transform and visualisation operations.
You can follow along with this guide using our simple_jupyter_fetch example notebook.
Fetching Data
Dataset data can be retrieved by invoking fetch as follows:
from matatika.library import MatatikaClient

# create the client and call 'fetch'
client = MatatikaClient(auth_token, endpoint_url, None)
data = client.fetch(dataset_id)
By default, the method will return a Python dictionary object constructed from the raw API response. From here, with the use of data-centric libraries such as pandas, NumPy or SciPy, it becomes easy to begin analysing, transforming and visualising the data in useful ways.
Using the Data
We can create a pandas.DataFrame using the from_dict method, and supplying the Matatika client-library fetch method return value as the argument.
import pandas as pd

# create the dataframe from the dataset data dictionary
df = pd.DataFrame.from_dict(data)
df.head()
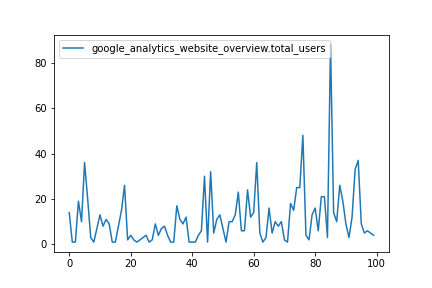
The resulting dataframe can be visualised using the plot method, which functions as a wrapper for the plotting backend (by default this is Matplotlib).
df.plot()
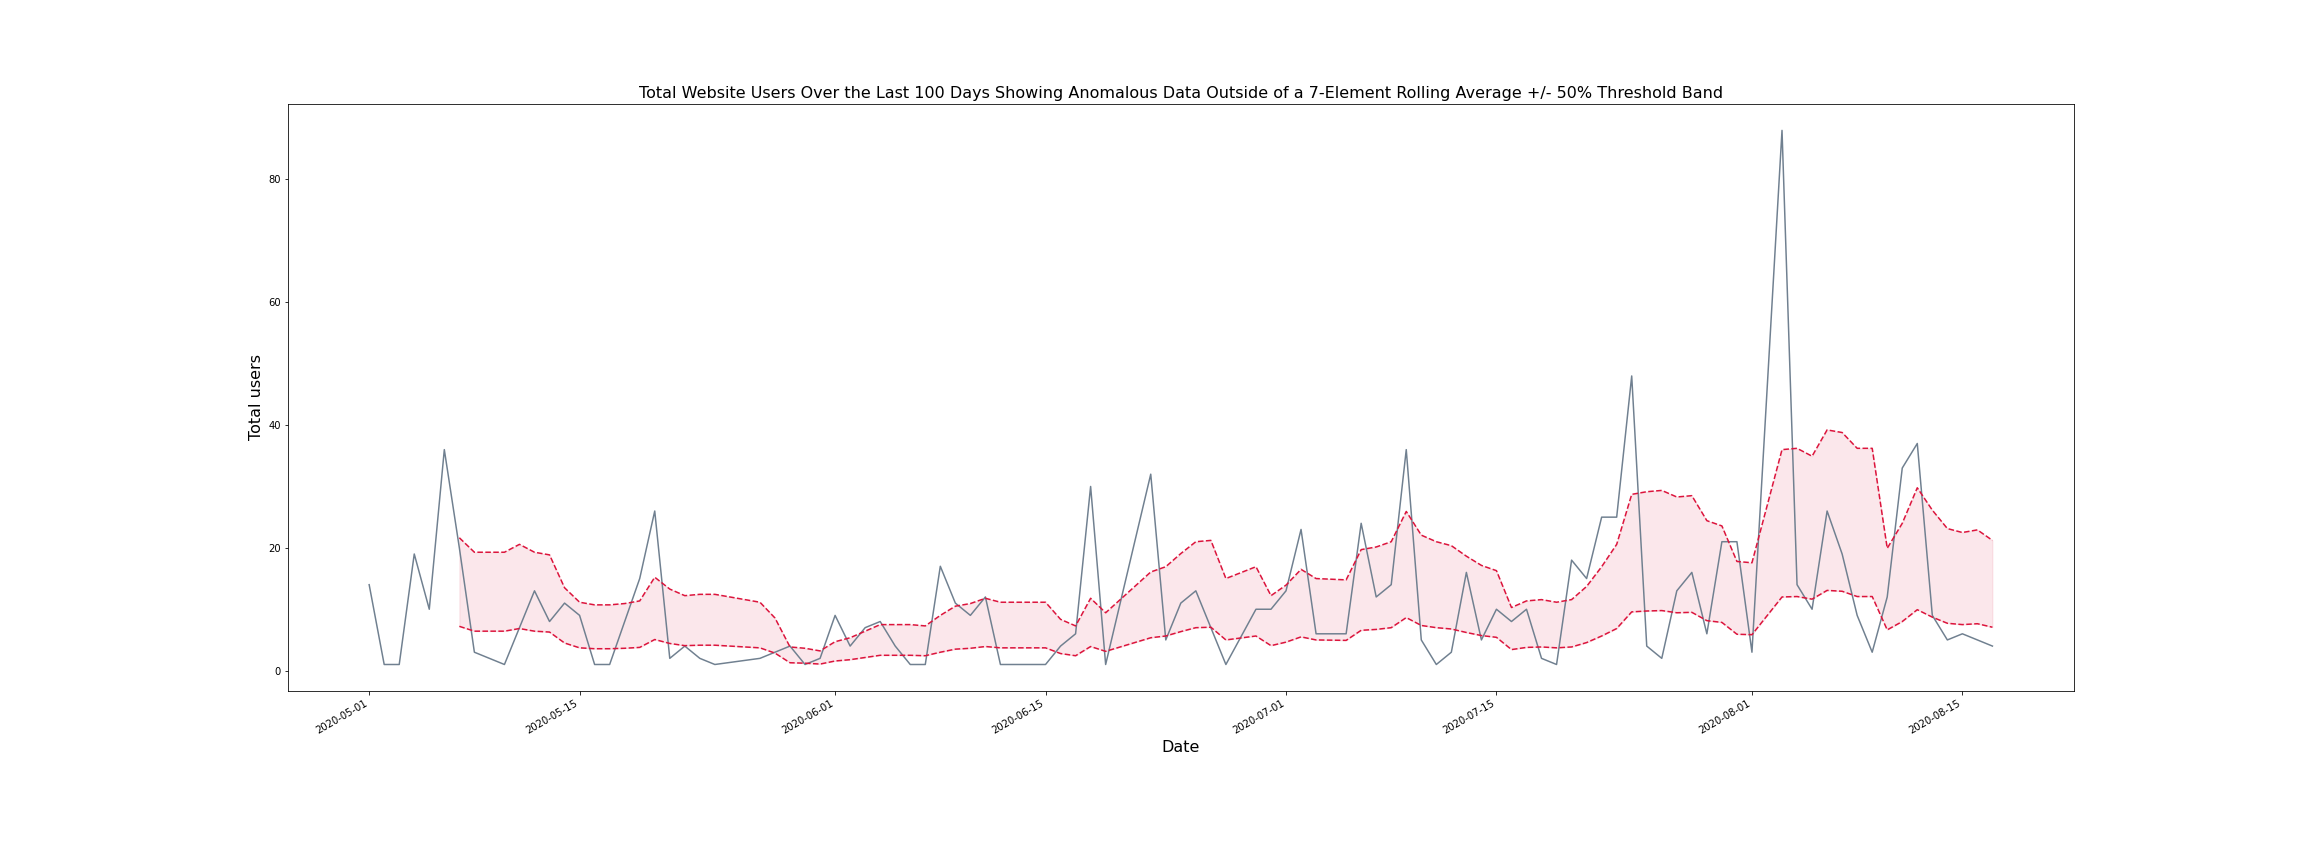
After some data clean-up, processing, and visualisation adjustments, it is possible to create plots that offer tailored insights.